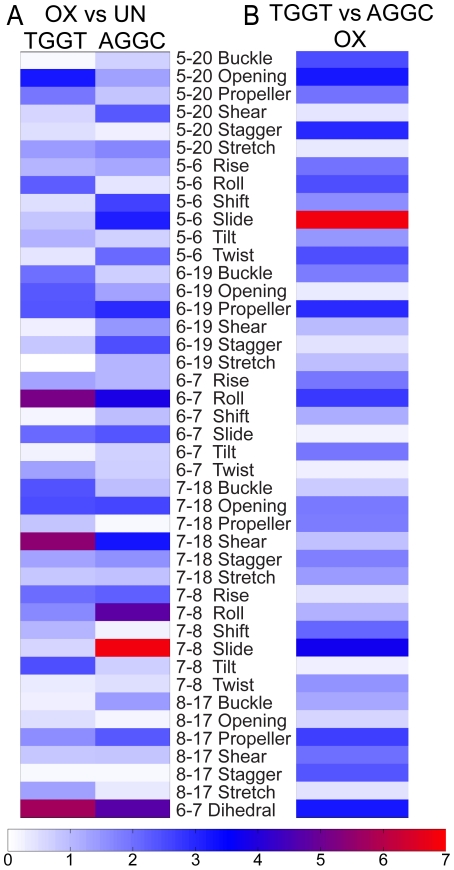
Figure 4. Conformational differences between the NMR structures of OX-DNA and undamaged DNA in the TGGT and AGGC sequence contexts.
Heat maps of the Z-scores from comparisons of the 14 lowest energy NMR structures of OX-DNA and undamaged DNA in the TGGT and AGGC sequence contexts (A), and Z-scores of comparisons between the OX-TGGT and OX-AGGC DNA adducts (B).

