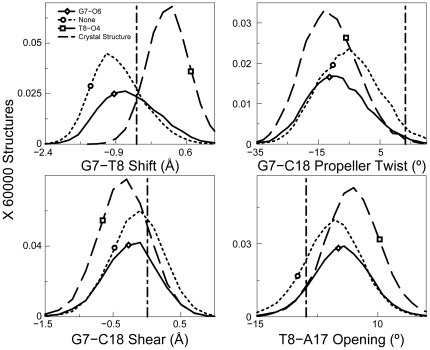
Figure 8. Helical parameters in the CP-TGGT sequence context.
Four helical parameters plotted as a histogram for CP-TGGT. The most significant differences for different hydrogen bonded species of CP-DNA adduct are shown. The normalization was performed over the full 60000 structures to show the relative abundance of different hydrogen bonded species. The distribution for structures with no hydrogen bond formation is plotted in dotted lines, structures with G7-O6 hydrogen bond are designated by a solid line and structures containing a T8-O4 hydrogen bond are plotted in dashed line. The corresponding helical parameters for DNA in the crystal structure of CP-DNA bound to HMGB1a are plotted as a vertical dashed line.

