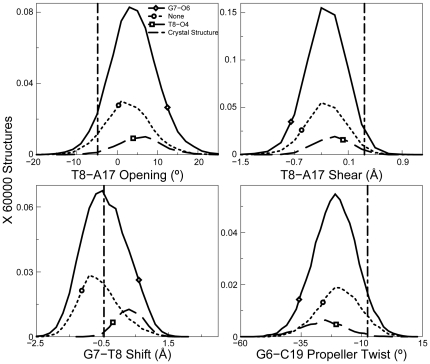
Figure 9. Helical parameters in the OX-TGGT sequence context.
Four helical parameters plotted as a histogram showing the most significant differences for different hydrogen bonded species of the OX-DNA adduct are shown. The frequency distributions were calculated in a manner identical to that described in Figure 8. The distribution for structures with no hydrogen bond is plotted in dotted lines, for structures with G7-O6 hydrogen bond plotted with a solid line and structures with T8-O4 hydrogen bond, is plotted in dashed line. The bend angle of DNA in the crystal structure of CP-DNA bound to HMGB1a is plotted as a vertical dashed line.

