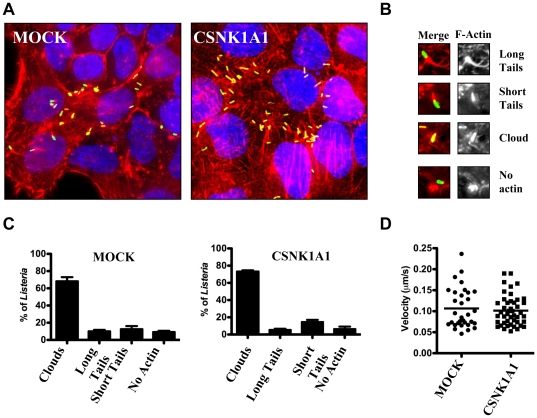
Figure 3. Characterization of actin-based motility in wild-type and CSNK1A1-depleted cells.
(A) Representative images showing actin tails formed by L. monocytogenes in mock-treated and CSNK1A1-depleted cells. Merged image: green, Bacteria; red, F-actin; blue, DNA. (B) Representative images of the scored actin tail patterns. Left panel: Merged image: green, Bacteria; red, F-actin. Right panel: F-actin only. (C) Quantification of scored actin tail patterns as shown in (B) in mock-treated and CSNK1A1-depleted cells. Values represent the mean and standard deviation of 4 independent experiments. (D) Cytosolic velocity measurements in mock-treated and CSNK1A1-depleted cells.

