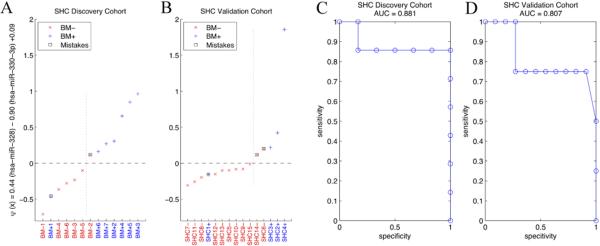
Figure 1. Data analysis for SHC Discovery and SHC Validation cohorts.
(A and B) Discovery and validation for BM− and BM+ using miR-328 and miR-330-3p in the SHC Discovery and SHC Validation cohorts, respectively. Sensitivity and specificity are 0.8571 and 0.8333 for the SHC Discovery cohort and 0.7500 and 0.8182 for the SHC Validation cohort. (C and D) ROC curve for SHC Discovery and SHC Validation cohorts, respectively.

