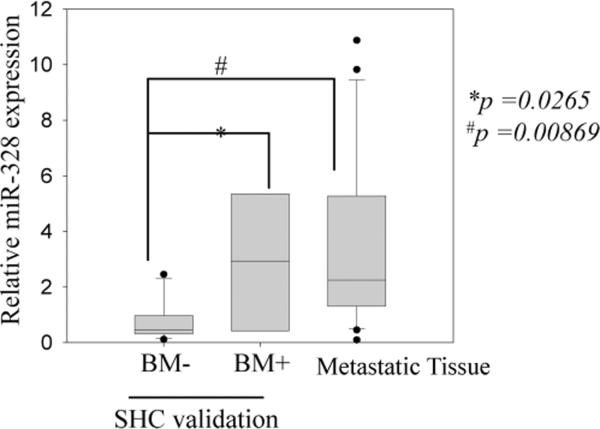
Figure 2. Relative expression of miR-328 in the validation cohort.
Box plot showing the relative expression of miR-328 in the validation set represents the interquartile range (25–75th percentile) and the line within this box is the median value. Bottom and top bars of the whisker indicate the 10th and 90th percentiles, respectively. Outlier values are indicated (closed circles). Significance between the indicated classes of specimens was tested using a two-sample t-test assuming unequal variances. The expression was normalized to the expression of 5S-rRNA in all samples plotted as fold change to A549 miR-328 expression (used as a reference).

