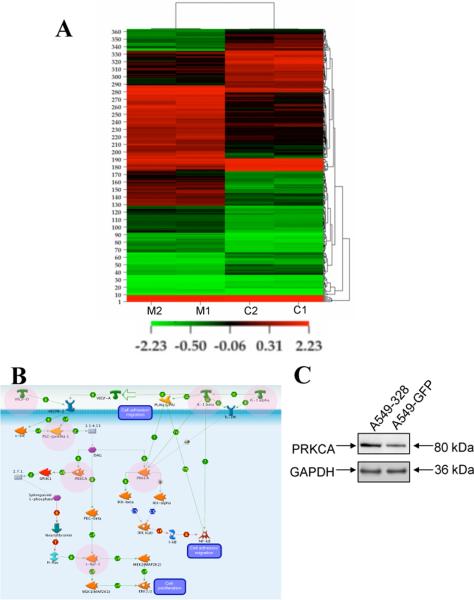
Figure 3. Gene and protein expression analysis in A549-empty and A549-328 cells.
(A) Hierarchical Clustering of 363 Genes Filtered at p value < 0.05 and fold change ≥ 2; 1 and 2 represent the duplicate runs. (B) A representative VEGF/IL1 signaling pathway leading to cellular migration/adhesion/proliferation that might be affected as a result of miR-328 over-expression. Protein products of several of the differentially-expressed genes are involved in this signaling cascade (these proteins are marked in pink circles). (C) Western blot showing over-expression of PRKCA in A549-328 cells as compared to A549-empty cells. GAPDH was used as a loading control.

