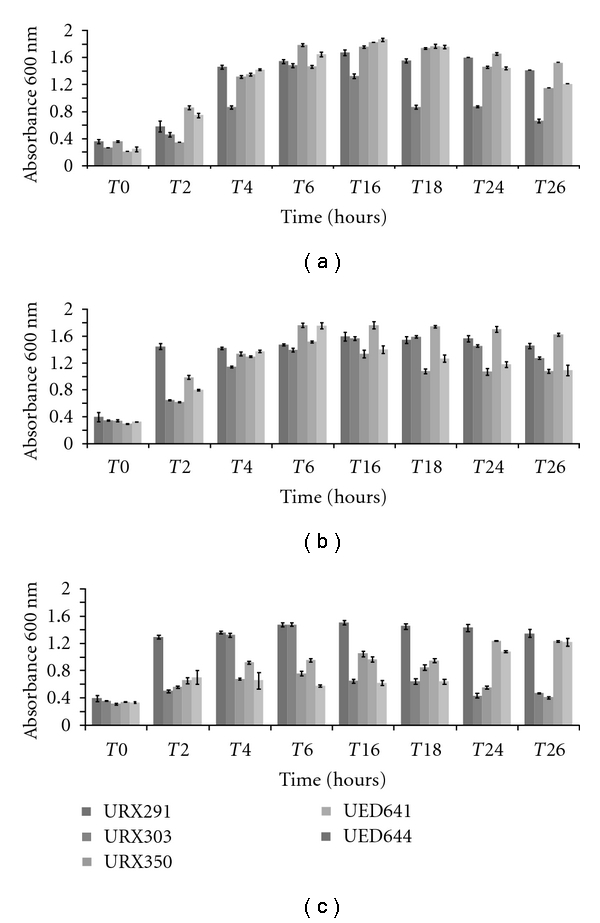
Figure 1.

Growth pattern of five isolates over 26-hour period. (a) 30°C, (b) 39°C, and (c) 45°C. All growth curves were done in triplicates for all three temperatures, the bars represent standard deviation.

Growth pattern of five isolates over 26-hour period. (a) 30°C, (b) 39°C, and (c) 45°C. All growth curves were done in triplicates for all three temperatures, the bars represent standard deviation.