Fig. 2.
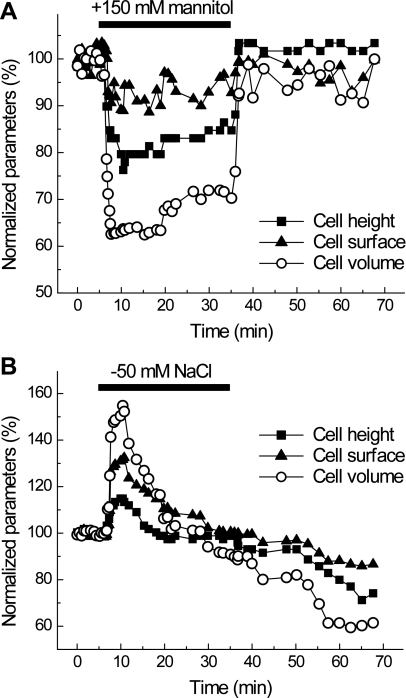
Cell-volume dynamics in C11-MDCK cell exposed to hyperosmotic (A) or hyposmotic (B) media. A: representative time course of changes in height, surface area, and volume of cell superfused for 30 min with hypertonic medium (+150 mM mannitol). Initial values were taken as 100%. B: representative time course of changes in height, surface area, and volume of C11-MDCK cell superfused for 30 min with hypotonic medium ([NaCl]o reduced from 135 to 85 mM). Initial values were taken as 100%.

