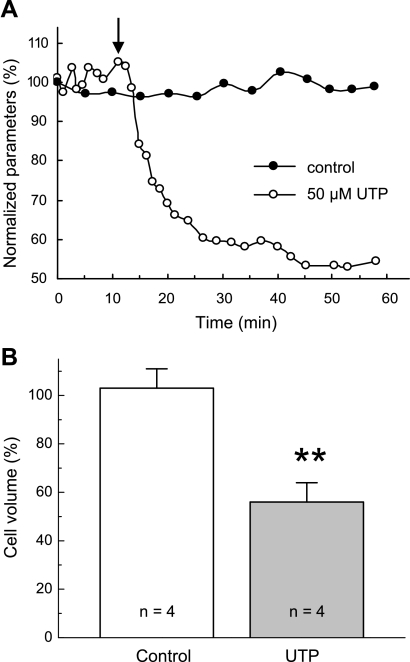
Fig. 3.
Effect of the P2Y agonist UTP on C11-MDCK cell volume. A: representative time course of changes in the volume of control cells (●) and cell superfused for 30 min with isosmotic medium containing 50 μM UTP (○). The moment of UTP addition is shown by arrow. Initial values were taken as 100%. B: average cell-volume changes in cells subjected to 60-min perfusion with isosmotic medium (control) or superfused for 30 min with 50 μM UTP and followed by 30 min of UTP-free medium (UTP). UTP was added in 5 min of initial perfusion with isosmotic medium as shown in A. Initial values of cell volume measured before the addition of UTP or vehicle were taken as 100%. Data represent mean values ± SE obtained in 4 independent experiments. **P < 0.01 vs. control.

