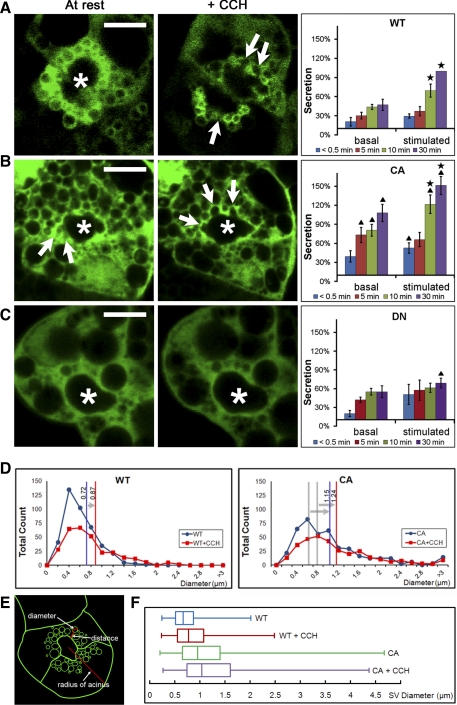
Fig. 7.
Rab27b positively regulates SV exocytosis. A: still-frame images of live YFP-WT Rab27b-expressing acinar cells depict Rab27b expression in the subapical region at resting state, when SV are enriched within the subapical region, and 15 min after the addition of CCH, at which time SV fuse with the APM (sites of fusion are shown by arrows). In biochemical secretion studies conducted in parallel in LG acinar cells doubly expressing both Xp-WT Rab27b and syncollin-GFP, CCH stimulation significantly increased syncollin-GFP release into the cell medium (stars). For reference, only 20–30% of total cellular syncollin-GFP is secreted within this stimulation time as we have shown in previous studies (25). *, Lumen; bar = 10 μm; n = 7. B: in still-frame images, SV labeled with YFP-tagged CA Rab27b showed increased evidence for fusion with the APM even at resting state and also after CCH stimulation. Corresponding secretion data showed that LG acinar cells expressing the CA form responded with a significant increase in secretion in response to CCH addition (stars) but also exhibited significantly more secretory activity relative to LG acinar cells expressing the WT Rab27b both in the resting and in the CCH-stimulated state (triangles). *, Lumen; bar = 10 μm; n = 7. C: in still-frame images, YFP-tagged DN Rab27b did not appear to label subapical SV. In the biochemical secretion study, DN-expressing cells also displayed a loss of response to CCH stimulation, and secretion levels were significantly less than WT by 30 min (triangles). *, Lumen; bar = 10 μm; n = 6. D and E: the diameters of Rab27b enriched SV membranes (green) which, in the schematic shown, included all SV apparent in the plane within half the maximal radius of the cell from the center of the lumen, were measured in resting acini and at 10 min after CCH stimulation. DN was not quantified because Rab27b signal was diffuse. WT: 412 SV; WT+CCH: 297 SV; CA: 431 SV; CA+CCH: 324 SV; n = 12. F: SV diameter measurements were summarized in a box-and-whisker plot. CA SV diameter was significantly greater at both resting and stimulated phases compared with WT. For all data, values are means ± SE; P < 0.05.

