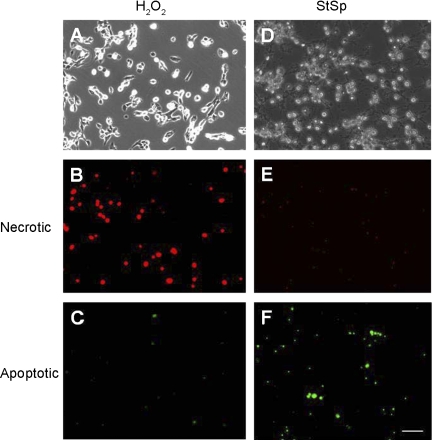
Fig. 6.
Preferential induction of necrosis by H2O2. A–F: representative pictures from myoblasts subjected to H2O2 (A–C) and StSp (D–F) and photographed under bright field light conditions (A and D), under TRITC filter (red, 610 nm; B and E), or under FITC filter (green, 530 nm; C and F). Bar in F is for all pictures and indicates 100 μm.

