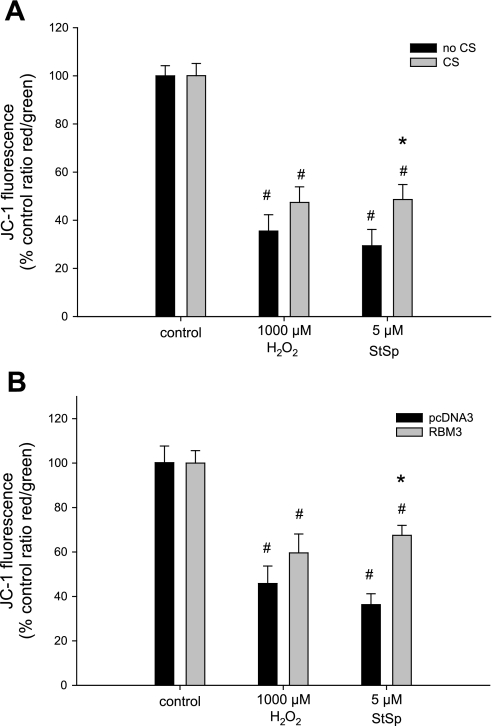
Fig. 8.
Protection of mitochondrial membrane potential dissipation by CS only in response to StSp. Decrease in mitochondrial membrane potential in myoblasts with (gray bars) and without (black bars) CS (n = 3–5) (A) or transfected with pcDNA3 (black bars) or RBM3 (gray bars) (n = 5–8) (B) in response to H2O2 and StSp is depicted. #Significant difference from control conditions; *significant difference from no CS. Values are means ± SE; P < 0.05.

