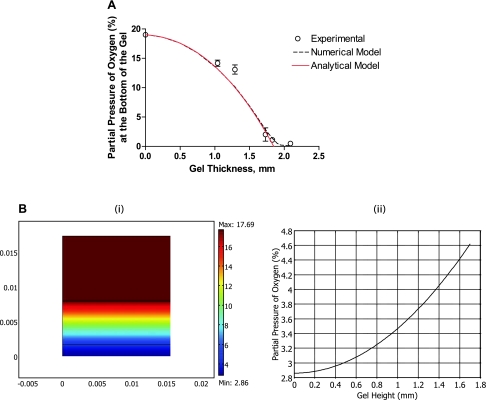
Fig. 2.
Model prediction of DO levels and gradients. A: steady-state DO at the bottom of collagen gels at different gel thicknesses. We fitted model numerical predictions (dashed black line) and analytical prediction (solid red line) to the experimental values (○) to determine Vmax and Km using the residual sum of squares method. B: model predictions for oxygen gradient after 24 h of culture in the three-layer model (Bi) and across the gel (Bii).

