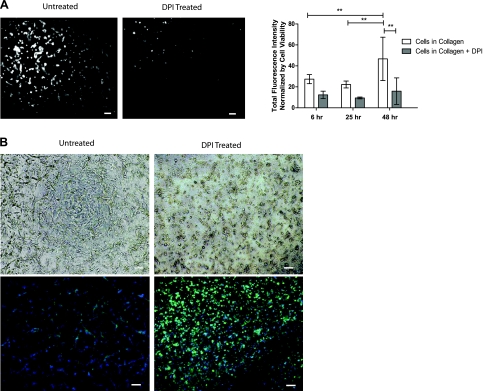
Fig. 3.
Intracellular ROS generation during 3D culture of HUVECs in collagen gels. A: fluorescence images of intracellular ROS in untreated and DPI-treated 3D HUVEC cultures after 48 h (left) and quantification of the ROS fluorescence intensity at multiple points, normalized by cell viability (right). **P < 0.01. B: tube formation of untreated and DPI-treated HUVECs after 48 h using light microscope images (top) and fluorescence microscope images (bottom; phalloidin in green, nuclei in blue). Scale bars, 100 μm.

