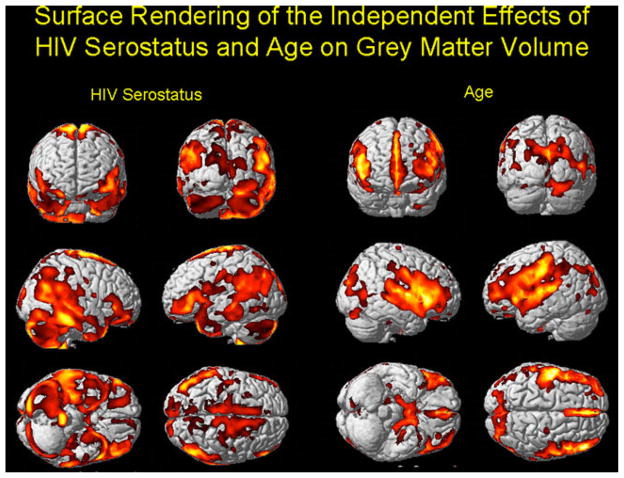
Fig. 1.
The results of the VBM analysis of gray matter projected onto the single-subject template of the cortical surface from SPM2. The effects of age are shown in the right-hand columns, and the effects of HIV disease in the left-hand columns. Both variables were entered into the same analysis simultaneously, with total intra-cranial volume as a covariate. False discovery rate=p<.05, with an extent threshold of 100 voxels. The regions with the hotter colors are those with the greatest amount of atrophy attributable to age or HIV status

