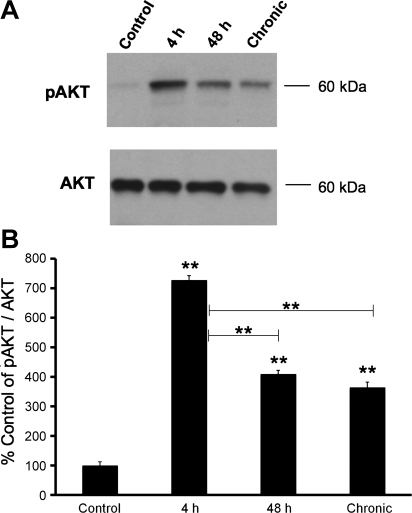
Fig. 1.
A: representative Western blot of phosphorylated (p) AKT expression in whole urinary bladders (25 μg) from control rats and those treated with cyclophosphamide (CYP) for varying duration. Total AKT expression was used as a loading control. B: summary histogram of relative pAKT band density in each group normalized to total AKT expression expressed as a percentage (%) of control in the same samples. Four-hour, 48-h, and chronic CYP-treatment significantly (P ≤ 0.01) increased pAKT expression compared with control urinary bladder. pAKT expression was significantly increased following 4-h CYP treatment compared with 48-h and chronic CYP treatment. Statistical analyses were performed on raw data using ANOVA as described in Statistical Analyses. Values are means ± SE. **P ≤ 0.01; n = 4 for each time point and control.

