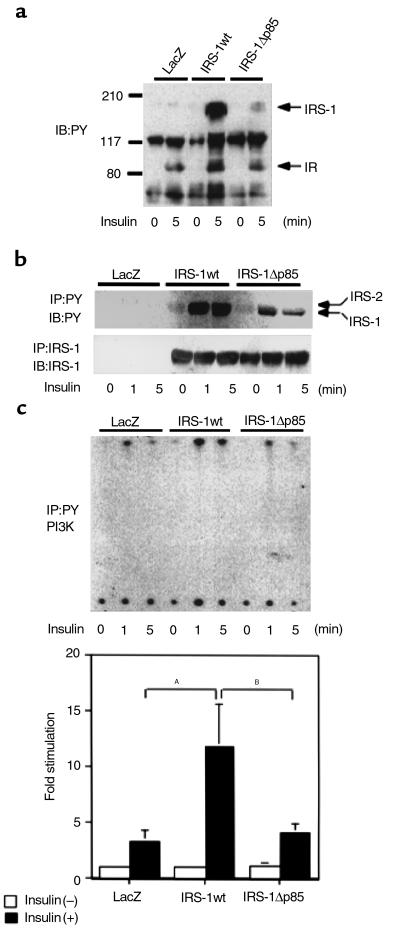
Figure 4.
Characterization of IRS-1wt– or IRS-1Δp85–mediated signaling events in IRS-1–deficient primary hepatocytes. (a) Tyrosine-phosphorylated proteins in the IRS-1–deficient primary hepatocytes expressing the indicated constructs. Cells were infected with adenovirus (moi 10) and cultured for 24 hours without serum as described in Methods. After being treated without or with 100 nM insulin for 1 minute, cell lysates were subjected to SDS-PAGE, followed by Western blot analysis (IB) with 4G10 (7% gel). (b) Time course of tyrosine phosphorylation on IRS proteins in the IRS-1–deficient primary hepatocytes expressing the indicated constructs. After being treated without or with 100 nM insulin for the indicated periods, cell lysates were immunoprecipitated (IP) with 4G10 (upper panel) or αIRS-1-CT (lower panel), and then the immunoprecipitates were subjected to SDS-PAGE, followed by Western blot analysis with the same antibodies. (c) Insulin-induced PI3K activity in the IRS-1–deficient primary hepatocytes expressing the indicated constructs. After being treated without or with insulin for the indicated periods, the cell lysates were immunoprecipitated with 4G10 and subjected to PI3K assay. The upper panel shows the representative result. In the lower panel, the results are expressed as the ratio to the value of LacZ without insulin, and each bar represents the mean ± SD of more than three independent experiments. AP < 0.01 LacZ insulin (+) versus IRS-1wt insulin (+). BP < 0.01 IRS-1Δp85 insulin (+) versus IRS-1wt insulin (+).

