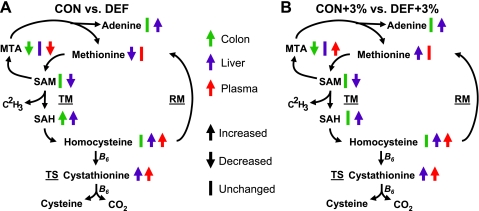
Fig. 8.
Summary of metabolomic results. An abbreviated version of the Met metabolic cycle representing the changes seen in colon (green), liver (purple), and plasma (red) with our deficient-diet studies. Arrows represent significant changes between control and deficient (A) or untreated and DSS (B) conditions.

