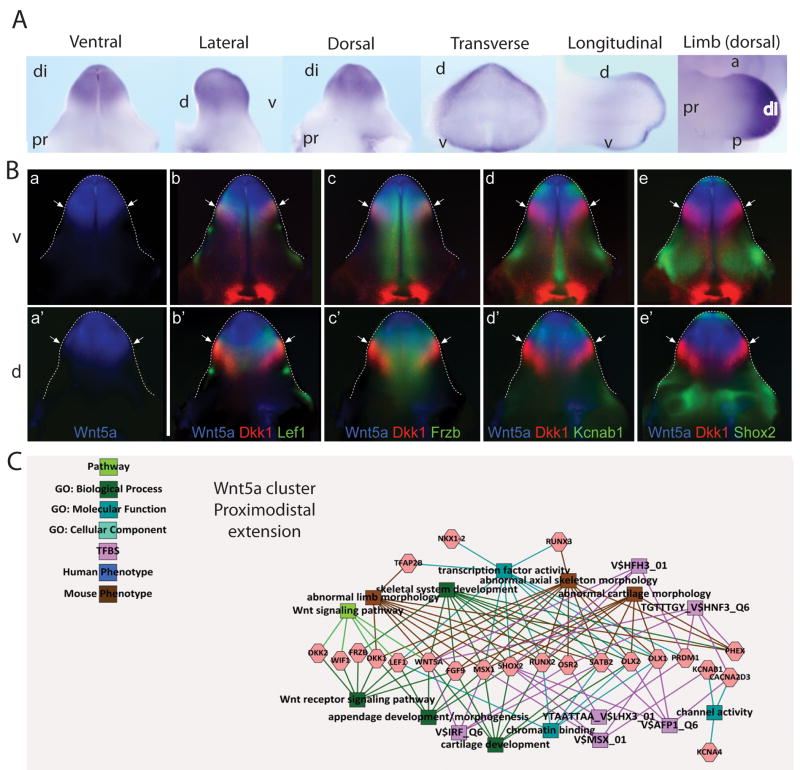
Figure 5. Identification of Wnt5a associated gene networks in GT development.
A. Wholemount ISH of Wnt5a in the developing E13.5 GT showing ventral, lateral, dorsal, transverse and longitudinal views, as well as Wnt5a expression in the limb (dorsal view). di, distal; pr, proximal; d, dorsal; v, ventral; a, anterior; p, posterior. B. Pseudo-colored expression pattern overlays of known and candidate genes of a Wnt5a network. Experimental WISH images of stage-matched genital tubercles at 13.5dpc were pseudo-colored and overlaid with either Wnt5a (a–e, a′–e′). Ventral (v; a–e) and dorsal (d; a′–e′) views are shown and the edge of the GT is outlined with a dotted line. Wnt5a network genes include Wnt5a alone (a, a′), Wnt5a/Dkk1/Lef1 (b, b′), Wnt5a/Dkk1/Frzb (c, c′), Wnt5a/Dkk1/Kcnab1 (d, d′) and Wnt5a/Dkk1/Shox2 (e, e′). Arrows indicate the border of the Wnt5a distal GT expression domain. All genes showed some degree of overlap with the Wnt5a domain. Dkk1 showed overlapping expression with Lef1 (b, b′) and Frzb (c, c′), in contrast to Kcnab1 (d, d′) and Shox2 (e, e′), which did not overlap with the distal Dkk1 domain. C. GT mesenchyme-enriched gene cluster associated via hierarchical clustering decorated with GO terms and known transcription factor binding sites and known human and mouse phenotype associations. This cluster shows strong links to limb morphogenesis, particularly of mesodermal elements including cartilage and bone.

