Fig. 1.
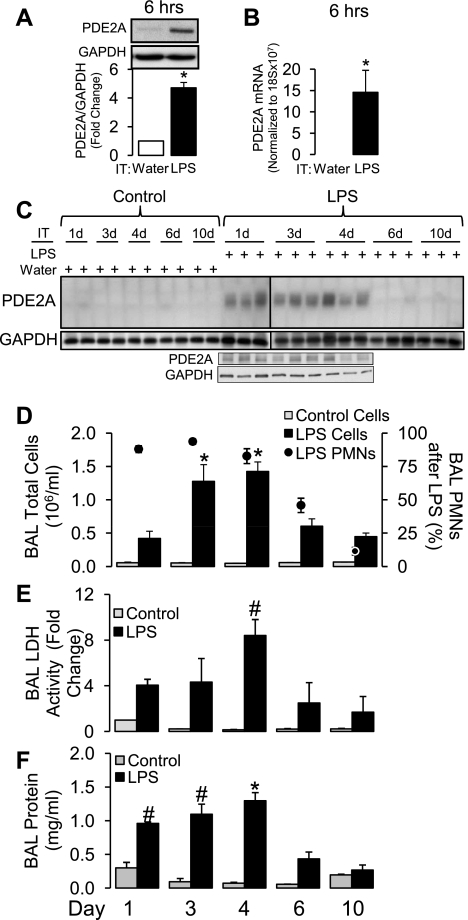
Lung phosphodiesterase 2A (PDE2A) protein expression by Western immunoblot (A; n = 5) and lung PDE2A mRNA (B; n = 3) by quantitative real-time PCR 6 h following intratracheal (IT) LPS. The PDE2A protein is normalized to GAPDH loading control and then to time-matched IT water mice (n = 2). The PDE2A mRNA is normalized to 18S ribosomal mRNA. No PDE2A mRNA was detected in IT water control lungs. Values are means ± SE. *P < 0.05. C: time course from 1–10 days (d) of lung PDE2A expression by Western immunoblot following IT water (n = 2 mice for each day) or IT LPS (n = 3 mice for each day) with GAPDH loading control. The vertical line between days 1 and 3 post-LPS separates 2 gels. A separate single immunoblot is shown for lungs from days 1, 3, and 4 following IT LPS to confirm that LPS-induced PDE2A expression was similar from days 1–4 following LPS administration. D: time course of bronchoalveolar lavage (BAL) total cells (bars) following IT water (n = 2-4 mice per day) or IT LPS (n = 3-6 mice per day) and % polymorphonuclear leukocytes (PMN) following LPS (circles). Values are means ± SE. *P < 0.005 vs. IT LPS mice on days 1, 6, and 10 post-LPS. E: time course of BAL lactate dehydrogenase (LDH) activity following IT water (n = 2–3 mice per day) or IT LPS (n = 3–4 mice per day). Values are means ± SE. #P < 0.05 vs. IT LPS mice on days 6 and 10 post-LPS. F: time course of BAL protein concentration following IT water (n = 2–3 mice per day) or IT LPS (n = 3–4 mice per day). Values are means ± SE. *P < 0.0001 vs. IT LPS mice on days 1, 6, and 10 post-LPS. #P < 0.0001 vs. IT LPS mice on days 6 and 10 post-LPS.

