
Figure 1.
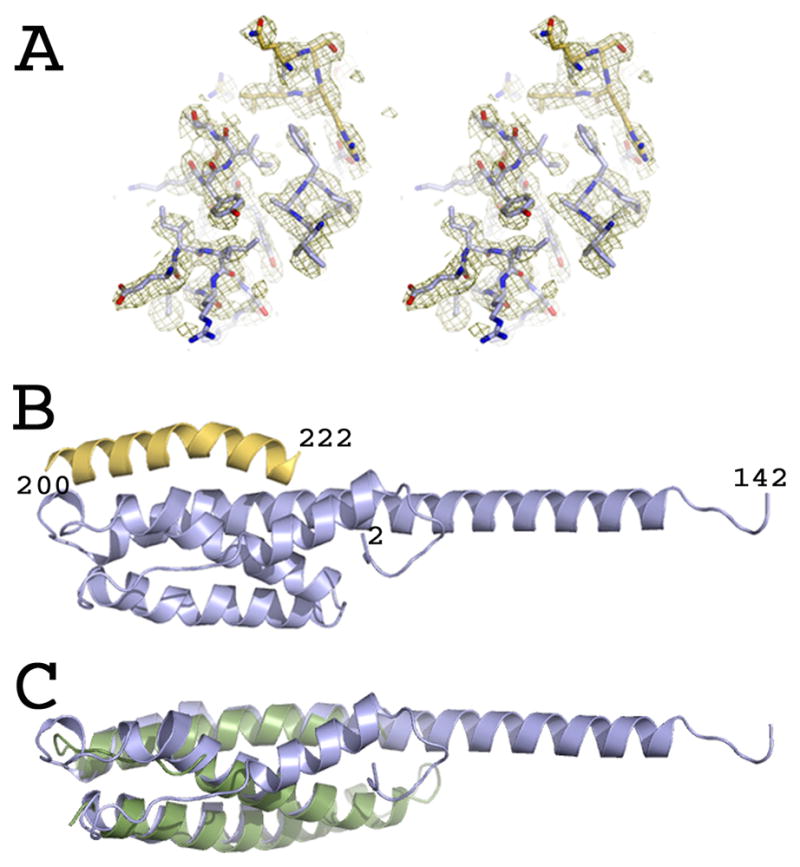
Crystal structure of AMSH in complex with CHMP3.
(A) Stereo image of the experimental electron density map obtained after SAD phasing.
(B) Ribbon representation of AMSHΔC (blue) in complex with CHMP3ΔN residues 200–222 (yellow).
(C) Overlay of the Cα atoms of AMSHΔC (blue) with the VPS4 MIT domain (pdb 2JQ9) (green ribbon). See also Figure S2.