
Figure 3.
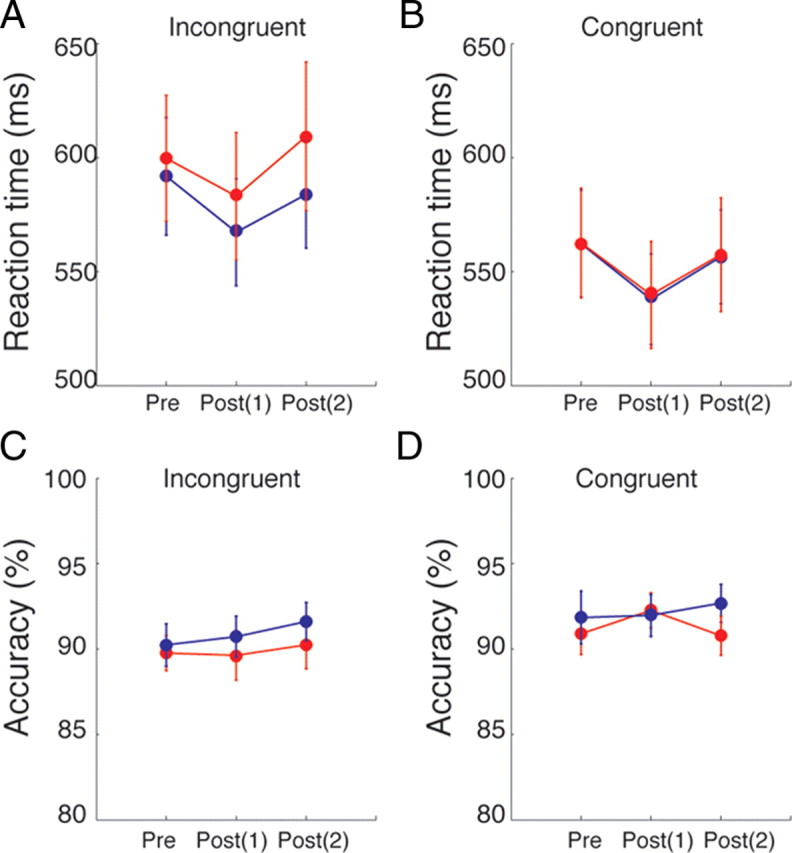
Reaction time and accuracy per condition. A, The mean RT for incongruent trials. B, The mean RT for congruent trials. C, The mean accuracy for incongruent trials. D, The mean accuracy for congruent trials. In all panels, red circles indicate the condition with TMS over the left SPL and blue circles the control condition with TMS over the vertex. Error bars indicate 1 SEM across 15 participants.