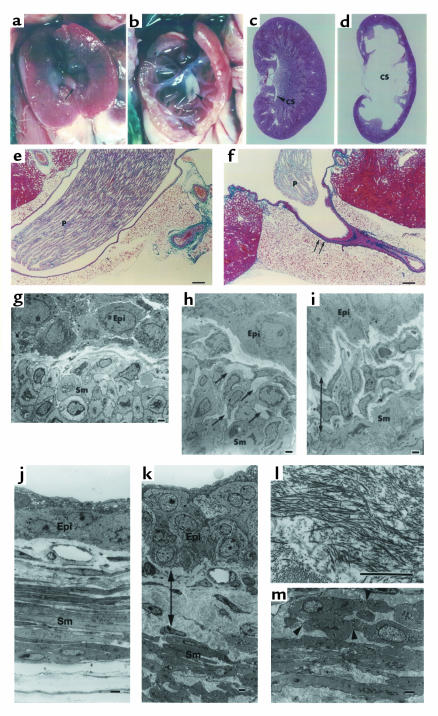
Figure 3.
Comparison of kidneys between ADAMTS-1+/+ (a, c, e, g) and ADAMTS-1–/– (b, d, f, h, i) mice at 4 weeks. (a and b) Inner aspects of the kidneys. Arrow, renal papilla; arrowhead, fibrous tissue surrounding the ureteropelvic junction. (c and d) Hematoxylin and eosin–stained sections of the whole kidney. CS, caliceal space. (e and f) Mallory-azan–stained sections through the renal hilum; the ureteropelvic junction of ADAMTS-1–/– mice is rich in fibrous tissue (arrows). P, renal papilla. (g–i) Electron microscopy findings at the ureteropelvic junction in ADAMTS-1–/– mice and controls. (h) Excessive collagen fibers (arrows) between smooth muscle cells (Sm) at the ureteropelvic junction of ADAMTS-1–/– mice. (i) Thickening of the collagenous segment between the epithelial cell (Epi) layer and smooth muscle cell layer (12–30 μm), and proliferation of fibroblasts at the ureteropelvic junction of ADAMTS-1–/– mice. (g) Collagenous segment between the epithelial cell layer and smooth muscle cell layer (6–12 μm) from the ureteropelvic junction of normal mice. (j–m) Electron microscopy ureteral findings in ADAMTS-1–/– mice (k–m) and controls (j). (k) Thickening of the collagenous segment (arrows) between the epithelial cell layer and smooth muscle cell layer. (l) High magnification showing the accumulation of excessive collagen fibers in ADAMTS-1–/– mice. (m) Deformity and fissures (arrowheads) in smooth muscle cells in ADAMTS-1–/– mice. Bars in e and f represent 20 μm; bars in g–m represent 2 μm.

