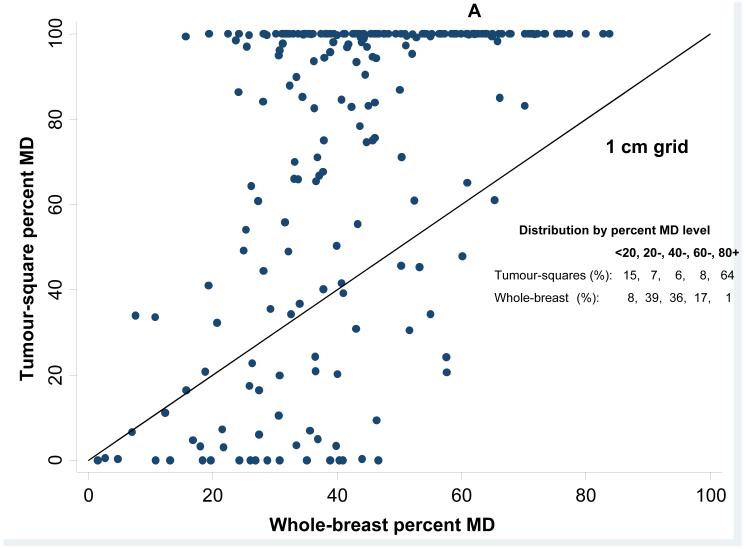
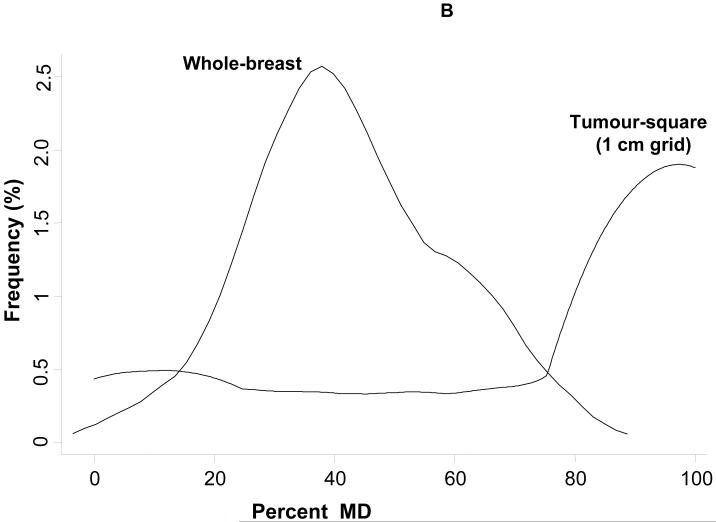
Figure 2.
Whole-breast versus tumour square-specific mammographic density (MD) in pre-diagnostic images: (A) Tumour square-specific percent density plotted against the corresponding whole-breast density for the same breast (the straight line represents the line of equality); (B) Relative distribution of whole-breast and tumour-square density values among all study participants.


