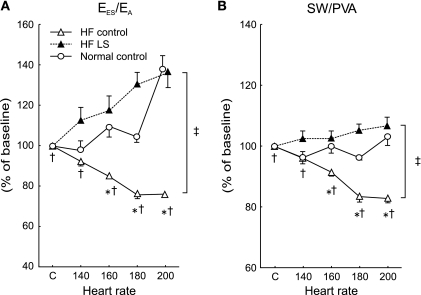
Fig. 3.
Group means of increasing HR-caused percent changes on the EES/arterial elastance (EA) (A) and stroke work/pressure-volume area (SW/PVA). In normal (○), compared with baseline, EES/EA and SW/PVA remained relatively unchanged. In contrast, after HF (▵), EES/EA and SW/PVA were progressively decreased. Following LS administration in HF (▴), this altered response to HR in EES/EA and SW/PVA was prevented. Error bar indicates SE. *P < 0.05 vs. corresponding baseline; †P < 0.05 vs. before HF; ‡ P < 0.05 on LS effects on HR change.

