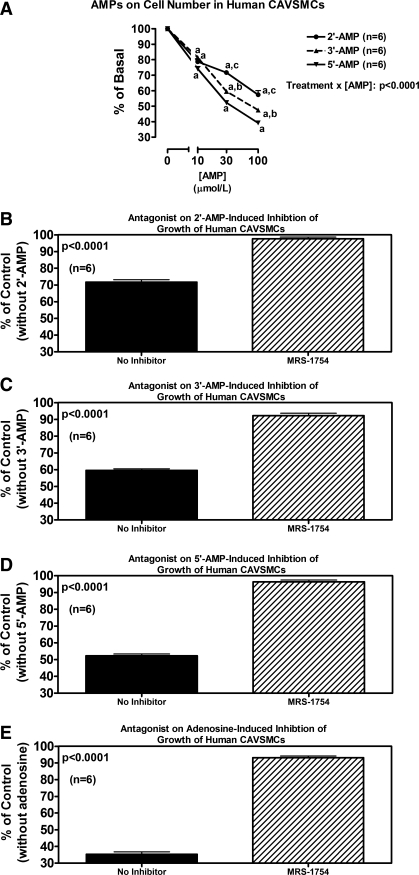
Fig. 10.
Line graph (A) illustrates the concentration-dependent effects of 2′-AMP, 3′-AMP, and 5′-AMP on cell number in human CAVSMCs. P value is interaction term from 2-factor ANOVA between type of AMP and concentration of AMP. aP < 0.05 (Fisher's LSD test) compared with corresponding basal (0). bP < 0.05 (Fisher's LSD test) compared with corresponding concentration of 5′-AMP. cP < 0.05 (Fisher's LSD test) compared with corresponding concentrations of 3′-AMP and 5′-AMP. Bar graphs illustrate effects of MRS-1754 (A2B antagonist; 0.1 μmol/l) on antiproliferative effects (cell number) of 2′-AMP (B), 3′-AMP (C), 5′-AMP (D), and adenosine (E) (each at 30 μmol/l) in human CAVSMCs. P values in B-E are from Student's unpaired t-test.

