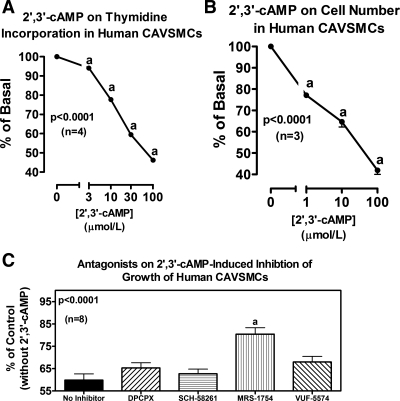
Fig. 9.
Line graphs illustrate the concentration-dependent effects of 2′,3′-cAMP on [3H]thymidine incorporation (A) and cell number (B) in human CAVSMCs. Bar graph (C) illustrates effects of DPCPX (A1 antagonist), SCH-58261 (A2A antagonist), MRS-1754 (A2B antagonist), and VUF-5574 (A3 antagonist) (each at 0.1 μmol/l) on inhibition of [3H]thymidine incorporation by 2′,3′-cAMP (30 μmol/l) in human CAVSMCs. P values are from 1-factor ANOVA. aP < 0.05 (Fisher's LSD test) compared with basal (0) (A and B) or compared with no inhibitor (C).

