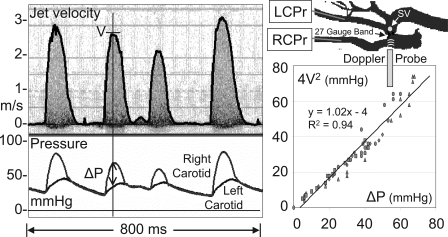
Fig. 4.
Velocity signals from the high-velocity jet in a mouse with a transverse aortic constriction (TAC) along with pressure signals from the right (RCPr) and left (LCPr) carotid arteries. The mouse shown had an arrhythmia such that the jet velocity (V) and the pressure drop (ΔP) varied with each cardiac cycle. The graph to the right shows data from the 5 pulses shown (including the very small one near the center) plus data from 4 other mice where the velocity was varied over a large range. SV, sample volume. As shown, the maximum jet velocity (in m/s) measured noninvasively can be used with the simplified Bernoulli equation (4V2) to estimate the maximum pressure drop (in mmHg) across the aortic constriction [from Li et al. (35)].

