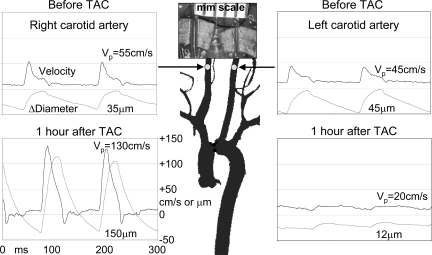
Fig. 7.
Velocity (in cm/s) and diameter change (in μm) signals taken noninvasively from the right and left carotid arteries of a mouse before and 1 h after TAC. After TAC, the pulsations in both velocity and diameter are increased in the right carotid artery proximal to the band and decreased in the left carotid artery distal to the band. The photo taken at death 2 wk later shows dilation of the right carotid artery because of increased pressure and/or wall shear stress. VP, peak velocity.

