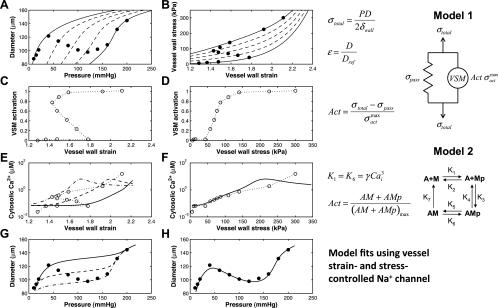
Fig. 3.
Comparison between vessel strain- and vessel stress-controlled channel functions in the myogenic response. A and B: experimental data of a Wistar-Kyoto (control) rat mesenteric myogenic response from Fig. 1 of Bund (3) given in diameter-pressure (A) and stress-strain (B) domains. Strain is calculated with respect to an estimated reference passive vessel diameter at 5 mmHg. Model 1 is used to draw lines of constant VSM activation (0, 0.25, 0.5, 0.75, and 1) to show levels of activation at each data point. The 2 panels of the second row show the activation level calculated from model 1 as a function of vessel strain (C) or vessel stress (D). The third row of panels uses model 2 to estimate the cytosolic Ca2+ concentration at each data point, which is again plotted against vessel strain (E) and vessel stress (F). Model 2 may overestimate the cytosolic Ca2+ concentration at full VSM activation (last three data points here). The fully integrated model is used to show 3 different fits to Ca2+ as a function of vessel strain with a strain-controlled supplementary Na+ channel inserted into the model (E) and a single fit as a function of vessel stress with a stress-controlled supplementary Na+ channel (F). The bottom 2 panels show the corresponding fully integrated model fits in terms of diameter-pressure with strain-controlled (G) and stress-controlled (H) supplementary Na+ channels. Solid data points in this figure refer to measured experimental data whereas open data points are estimated values calculated by using model 1 and model 2 portions of the fully integrated model.

