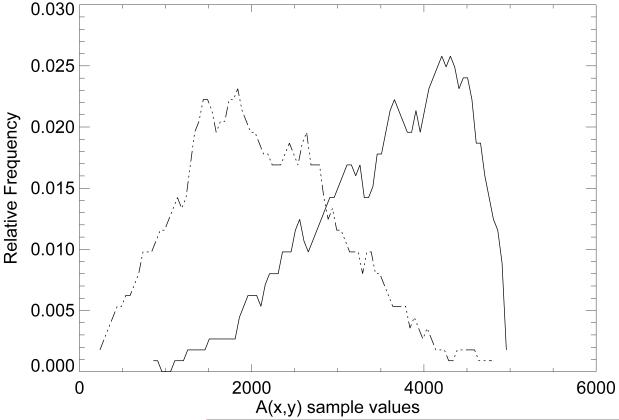
Figure 2.
Tissue distribution approximations. This figure shows the adipose (AT) and radiographically dense tissue (DT) pixel value distributions in the A(x,y) representation after transforming each sample average with Eq. (1). The transformed AT distribution (left) is represented by a dashed line and the transformed DT distribution (right) by a solid line.

