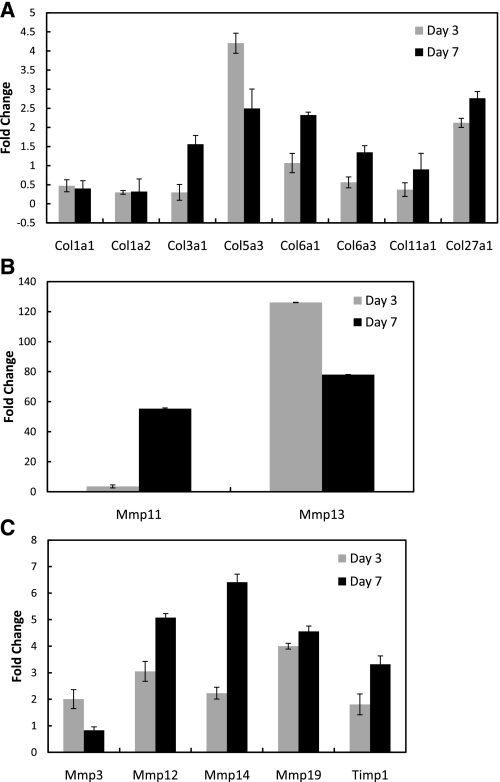
Fig. 4.
qPCR results of the genes of interest based on microarray results. A: qPCR analysis of genes found significantly regulated during microarray analysis or typically found in the ligament (as in the case for types I and III collagen). B: Mmps most significantly differentiated (Mmp11 and 13). C: other Mmps and Timp qPCR results. Data are expressed as fold change ± SE. Data were normalized with the housekeeping gene β-actin and compared with the normal intact ligament (and expressed as fold change).

