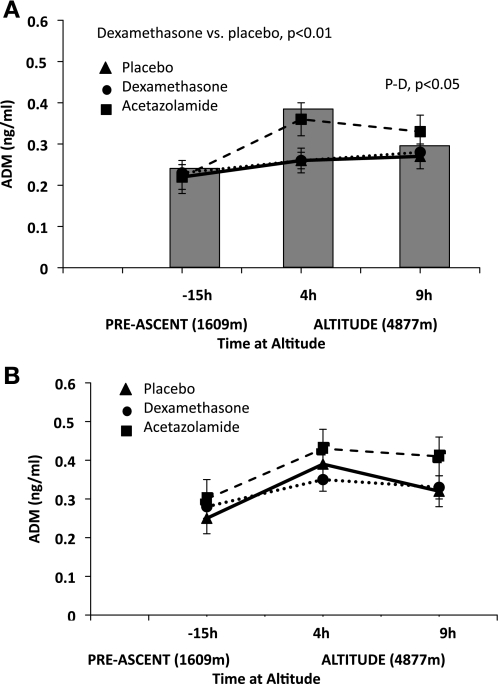
Fig. 3.
Comparison of acetazolamide and dexamethasone pretreatment on adrenomedullin (ADM). A: pretreatment with dexamethasone increased ADM values in AMS-S subjects during hypoxia (4 h, P < 0.10; and 9 h P < 0.05). The shaded bars behind the figure represent placebo ADM values for AMS-R subjects to better visualize placebo comparisons between AMS-S and AMS-R. B: dexamethasone tended to increase ADM at baseline in AMS-R subjects at baseline only. Symbols are as defined in Fig. 1 legend. Significant comparisons between placebo and drug pretreatment are designated in the figure by placebo vs. acetazolamide, or placebo vs. dexamethasone (P-D). Values are estimated marginal means ± SE.

