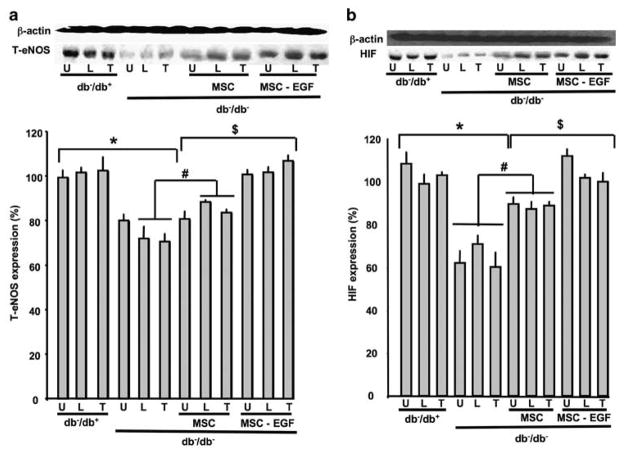
Figure 5.
(a) Western blots analysis and quantitative data showing total eNOS (T-eNOS) and β-actin expression in hind-limb ischemic muscles (quadriceps ‘U’, gluteus ‘L’ and tibia muscles ‘T’) from all groups (db−/db+, db−/db−, db−/db− injected with MSCs and db−/db− injected with MSCs prestimulated with EGF), n =6; *P<0.05 statistically significance between db−/db+ and db−/db−; #P<0.05 statistically significance between db−/db− and db−/db−+MSCs; $P<0.05 statistically significance between db−/db− + MSCs and db−/db−+MSCs-EGF. (b) Western blots analysis and quantitative data showing hypoxia-inducible factor (HIF) and β-actin expression in hind-limb ischemic muscles (quadriceps ‘U’, gluteus ‘L’ and tibia muscles ‘T’) from all groups (db−/db+, db−/db−, db−/db− injected with MSCs and db−/db− injected with MSCs prestimulated with EGF), n =6; *P<0.05 statistically significance between db−/db+ and db−/db−.

