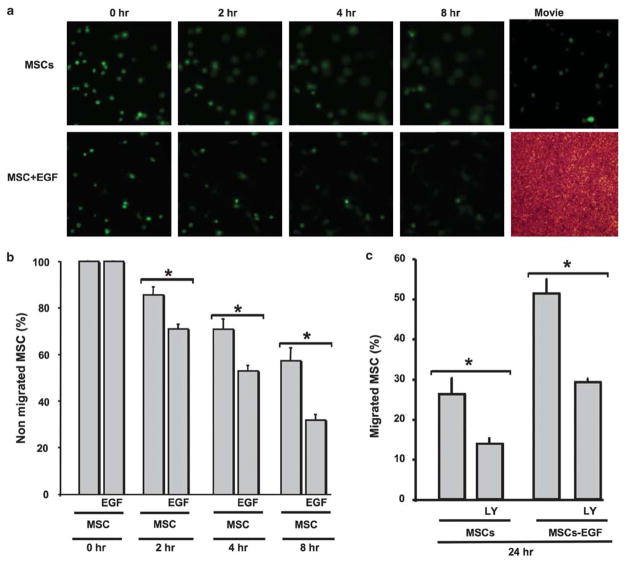
Figure 7.
(a) Life imaging migration of MSCs and MSCs +EGF at 0, 2, 4 and 8 h (see Supplementary Movie online). (b) Quantitative data showing percent of nonmigrated MSCs alone or stimulated with EGF at 0, 2, 4 and 8 h, n =6; *P<0.05 statistically significance between MSCs +EGF and MSCs. (c) Quantitative data of migrated MSCs alone or MSCs +EGF in the presence of PI3-kinase-Akt inhibitor (LY, 1 μM) after 24 h incubation time, n =6; *P<0.05 statistically significance between MSCs vs MSCs +LY; MSCs +EGF and MSCs +EGF +LY.

