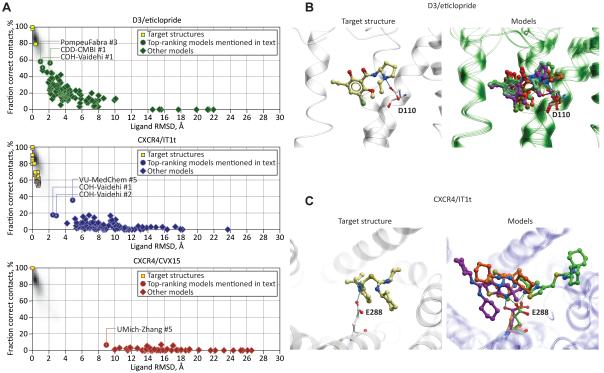
Figure 5. Prediction of ligand pose and its atomic contacts with the pocket residues for the three targets in GPCR Dock 2010 assessment.
(A) Scatter plots of ligand RMSD and correctly reproduced contact strength ratio values for the models of the three assessment targets (source data is provided in Supp. Table S2). The shaded plot background represents the distribution of the corresponding parameters for pairs of NCS-related molecules in a large subset of PDB structures.
(B-C) Superimposition of the top models that correctly reproduced the critical hydrogen bonding interaction of the ligand with D110 in D3/eticlopride complex (B) and with E288 in CXCR4/IT1t complex (C). Capturing these interactions does not correlate with the correctness of the ligand pose in case of CXCR4, and only weakly correlates in case of D3.

