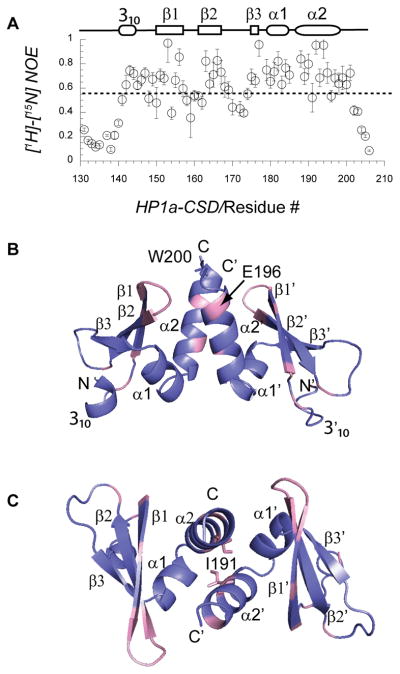
Figure 3. High resolution structure and NOE data identify flexible regions of the CSD backbone.
A. Heteronuclear NOE data obtained from 15 N-relaxation analysis of the CSD fragment by NMR spectroscopy identified backbone amides that lack ordered structure ([1H]-15N NOE < 0.55). Secondary structure elements above the plot are derived from the crystal structure (rectangles = beta sheet, ovals = alpha helix). Terminal residues 131–140 and 202–206 are disordered. B, C. Ribbon diagram shows the crystal structure of HP1a CSD, which forms a homodimeric assembly of 2 CSD modules. Chain A consists of Thr 141 to Ser 199 and while chain B is resolved to Tyr 201. Flexible regions within the CSD module are colored pink; these have [1H]-15N NOE values of ≤ 0.55 (dashed line). Diagrams in B and C differ by rotating 90 degrees about the central axis.

