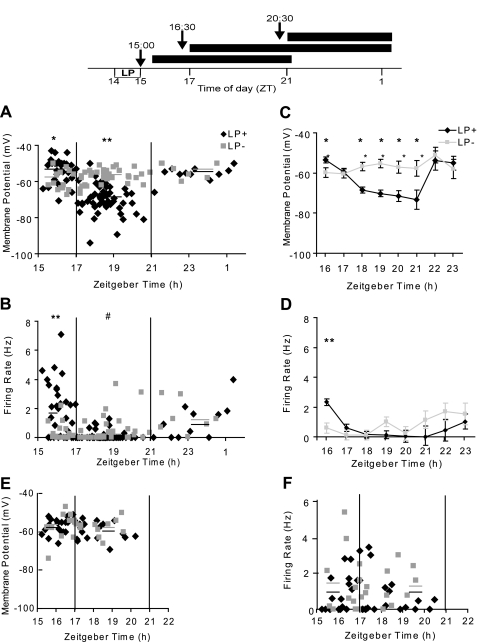
Fig. 2.
Top: experimental design. Experimental animals housed in a light-dark cycle were exposed to a light pulse (LP+) from Zeitgeber time (ZT) 14:00 to 15:00. Control mice were treated identically but were not exposed to light (LP−). The arrows indicate the time of euthanasia and are coded to the horizontal bars, which indicate the period of recording for animals euthanized at each of 3 indicated times. Typically, an individual cell was followed for ∼3 min for measurements of membrane properties and an additional 5–7 min for effect of drug treatment. Middle: time-dependent changes in membrane properties of cells of light-exposed GFP neurons (GFP+LP+) and GFP neurons not exposed to light (GFP+LP−). GFP+ neurons from mice were exposed to a 1-h light pulse (LP+) or not (LP−) between ZT 14:00 and 15:00. Resting membrane potential (A) and spike firing rate (B) of individual GFP+LP+ and GFP+LP− neurons as a function of ZT are shown. Solid lines are the mean for each time group. *P < 0.05; **P < 0.01 for GFP+LP+ vs. GFP+LP− in same time group. #P < 0.01 for GFP+LP+ at ZT 17:00–21:00 vs. 15:30–17:00. C and D: statistical treatment of data in A and B, respectively. Error bars indicate SE. *P < 0.05, **P < 0.01, GFP+LP+ vs. GFP+LP−. Bottom: time-dependent changes in membrane properties of cells of non-GFP neurons GFP−LP+ and GFP−LP−. The figure shows resting membrane potential (E) and spike firing rate (F) of GFP− cells as a function of ZT. Solid lines are the mean for each time group. There is no statistically significant difference between data of GFP−LP+ and GFP−LP− neurons.

