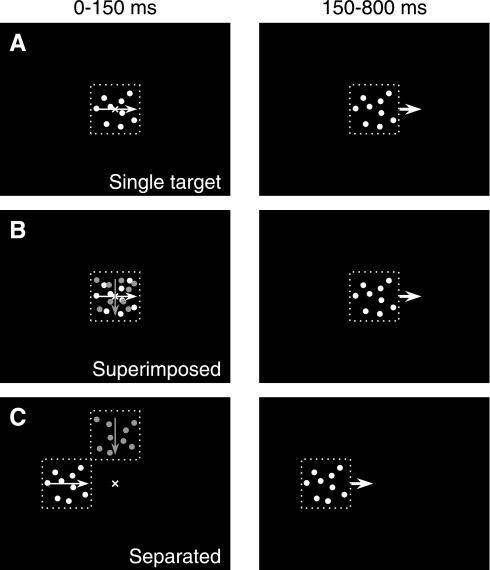
Fig. 1.
Schematic showing the visual stimuli and the sequence of presentation. Left: the first 150 ms of stimulus motion, when 1 or 2 patches of dots are visible and move behind an invisible, stationary aperture. Right: the next 650 ms of stimulus motion, when only 1 patch of dots is visible and the aperture and dots move together, en bloc, across the screen. A: single patch. B: 2 superimposed patches. C: 2 separated patches. Dashed squares represent the invisible apertures around the patches, white and gray dots represent bright or dim stimuli, thin arrows inside patches represent the directions of dots moving within the aperture, and thick arrows outside patches represent the directions of combined dot and aperture motion. Crosses in images on left represent the initial fixation spots, which disappeared as soon as the stimuli started to move.

