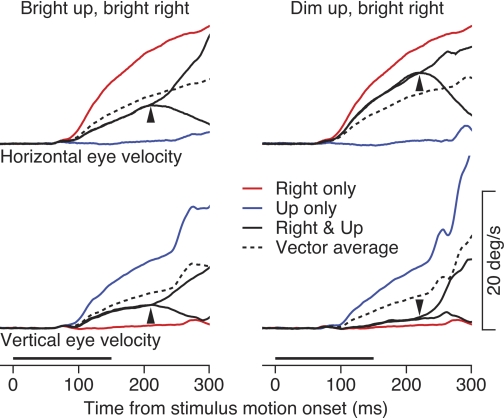
Fig. 2.
Average eye velocity traces showing examples of the initiation of pursuit for motion of 2 superimposed stimuli. Left: data for upward and rightward motion of bright stimuli. Right: data for rightward motion of a bright stimulus and upward motion of a dim stimulus, of luminance 1/8 of the bright stimulus. Each trace shows average horizontal or vertical eye velocity as a function of time. Red and blue traces show eye velocities evoked by the rightward and upward targets presented singly. Continuous black traces show eye velocities evoked by the simultaneous motion of the 2 stimuli. Dashed black traces show the predictions from the use of vector averaging to combine the responses to the 2 stimuli presented singly. Arrowheads show the time when the 2 black traces separated because the monkey had started to track 1 stimulus after the other disappeared. Bold horizontal lines at bottom indicate the time of simultaneous motion of 2 stimuli.

