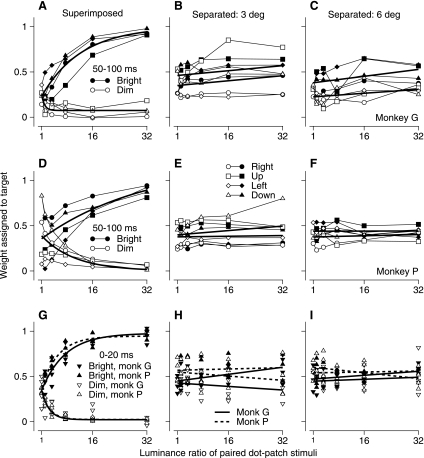
Fig. 6.
Effect of luminance ratio on the weighting of each patch of dots for the second 50 ms and first 20 ms of pursuit during simultaneous motion of 2 stimuli. Each symbol shows weights for 1 of the 2 targets, plotted as a function of the ratio of the brighter to the dimmer luminance. Filled and open symbols plot data for the bright and dim stimuli, respectively. A–F: data for the second 50 ms of pursuit. Different symbol shapes indicate data for different directions of stimulus motion. A–C: data for monkey G. D–F: data for monkey P. G–I: data for the 2 monkeys measured during the first 20 ms of pursuit. Upward and downward triangles show averages across target directions for the 2 monkeys. Continuous and dashed curves show fits for monkeys G and P, respectively. A, D, and G: superimposed stimuli. B, E, and H: stimuli presented 3° eccentric along orthogonal axes. C, F, and I: stimuli presented 6° eccentric along orthogonal axes.

