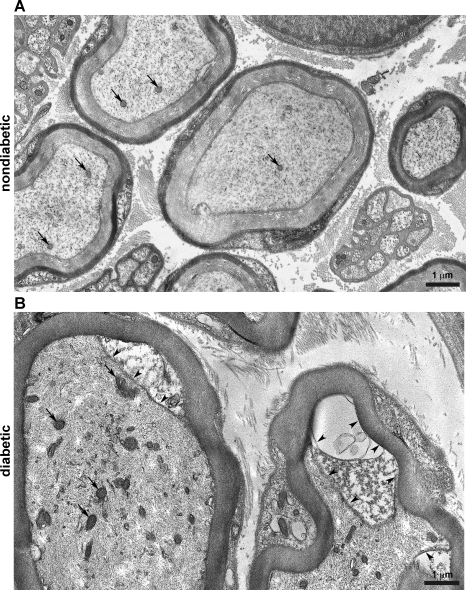
Fig. 3.
Diabetic nerves exhibit morphological changes at high magnification. A: high-magnification image of nondiabetic axons in a distal nerve segment stained with uranyl acetate and lead citrate (magnification: ×8,710). The central myelinated axon within the size range of a sensory Aβ-fiber (6–12 μm) exhibited a single mitochondrion, a lightly stained neurofilament network, and some more intensely stained microtubules. Smaller myelinated axons within the size range of sensory Aδ-fibers (1–5 μm) exhibited few mitochondria and a similar filament network. B: high-magnification image of diabetic axons in a distal nerve segment (magnification: ×9,260). Both axons fell within the size range of sensory Aβ-fibers. Both axons exhibited an increased number of mitochondria (arrows) and a dense neurofilament network compared with nondiabetic axons. The top right of the left axon demonstrated a widened interface between the Schwann cell and the axoplasm (arrowheads). The right axon demonstrated a similar area that was partly extracted (arrowheads).

