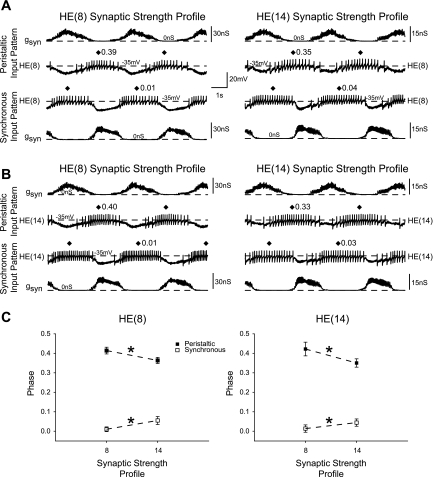
Fig. 3.
Heart motoneurons respond differently to different synaptic strength profiles. A: simultaneous intracellular recordings from a pair of HE(8) motoneurons receiving the segment 8 (left) followed by the segment 14 (right) input patterns. Both panels are from the same experiment. The synaptic strength profiles are different between the 2 segmental patterns (note the different scale bars). B: same as in A, but for the HE(14) motoneurons. Both preparations came from the same animal. C: the average phase (±SD, n = 6) of heart motoneurons in segments 8 (left) and 14 (right) each receiving the synaptic strength profiles for segments 8 and 14 are shown. Asterisks on each dashed line connecting data points indicate a significant effect of synaptic strength profile on motoneuron phase (2-way repeated-measures ANOVA, P < 0.05).

