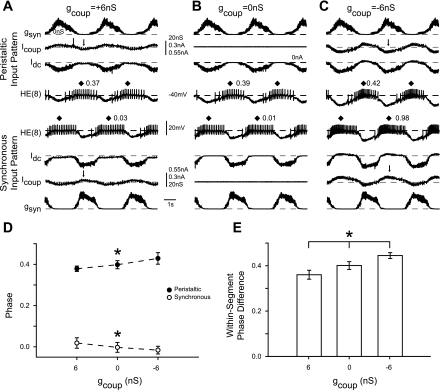
Fig. 7.
Effect of artificial coupling on HE(8) motoneuron phase: simultaneous intracellular recordings from the HE(8) motoneurons with the artificial coupling conductance gcoup set to −6 nS (A), 0 nS (B), and +6 nS (C). Each panel is from the same experiment. D: summary phase (average ± SD, n = 6) for the HE(8) motoneurons receiving the coupling conductances as described in A–C. Asterisks on each line indicate a significant difference in phase among the 3 artificial coupling values (1-way repeated-measures ANOVA, P < 0.05). E: summary (average ± SD, n = 6) within-segment phase difference between the 2 HE(8) motoneurons. Asterisks indicate a significant difference in the within-segment phase difference across the 3 artificial coupling values (1-way repeated-measures ANOVA, P < 0.05).

