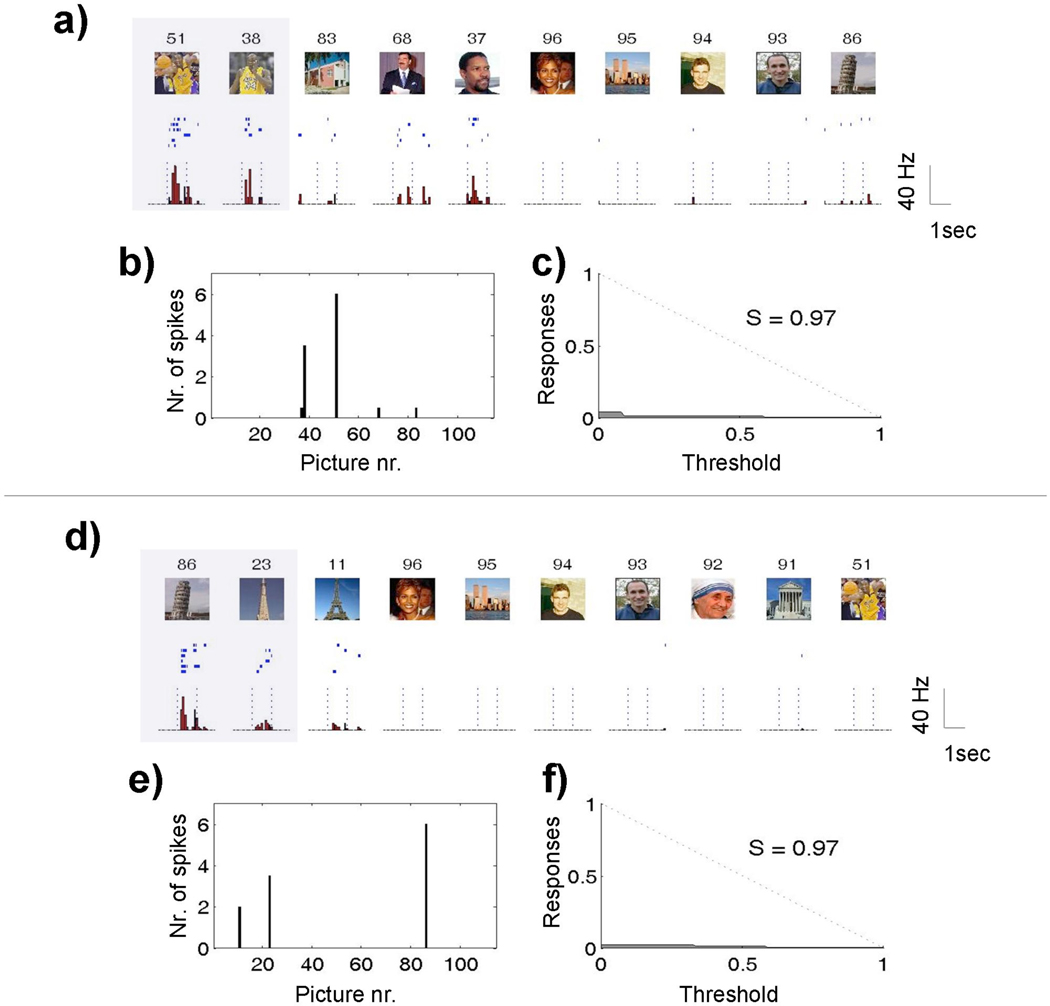
Figure 1.
a–d) Ten largest responses of two simultaneously recorded single units in the right posterior hippocampus. There were no responses to the other 104 pictures shown to the patient. For each picture (upper subplots) the corresponding raster plots (middle subplots; first trial on top) and post-stimulus time histograms with 100 ms bin intervals (lower subplots) are given. Highlighted boxes mark significant responses. The vertical dashed lines indicate the times of image onset and offset, 1 second apart. Note the marked increase in firing rate of these units roughly 300 ms after presentation of the responsive pictures. b–e) median number of responses (across trials) for all the pictures presented in the session. c–f) relative number of responses as a function of the variable threshold (see text). Note the high selectivity values for both units (S=0.97), thus implying a sparse representation. Data reprinted from (Quian Quiroga et al., 2007).

