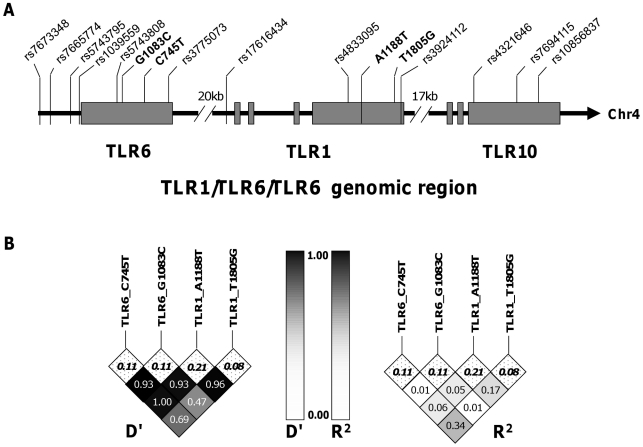
Figure 3. Haplotype tagging SNPs and pair-wise linkage disequilibrium analysis of TLR1-6-10 gene region.
A. The arrangement of TLR1 TLR6 and TLR10 on chromosome 4 and the position of the haploytype-tagging SNPs are shown. B. Linkage disequilibrium analyses between the four TLR SNPs with functional associations in this study are expressed as D' and R2 for pair-wise comparisons. The minor allele frequencies (MAF) are listed in the top row of boxes and highlighted in bold.

