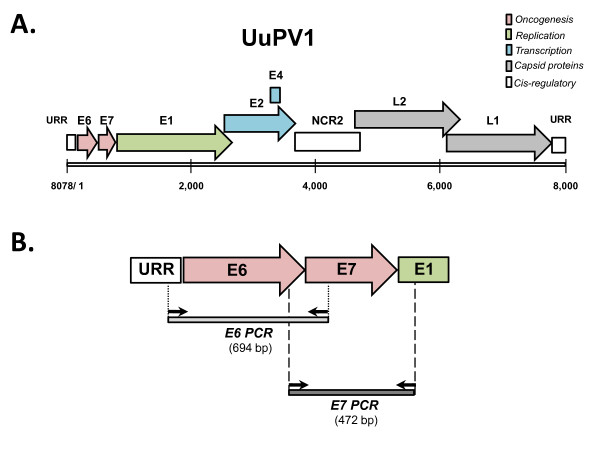
Figure 1.
Snow leopard PV1 genomic map and PCR strategy for detection of viral DNA. (a) Schematic representation of the linear Uu PV1 genome. The numbers indicate the genomic nucleotide positions. The individual open reading frames (ORFs) of the early (E) and late (L) genomic regions are depicted as shaded arrows, and are color-coded according to the known function of the corresponding gene product. The two cis-regulatory regions are depicted as open rectangles and consist of the upstream regulatory region (URR) and the second non-coding region (NCR2). (b) Schematic representation of the genomic targets for PCR-based detection of viral DNA. The primers used for amplification of the E6 and E7 genes are depicted as arrows, and the resulting amplification products as shaded rectangles. The size of each amplification product is indicated.

