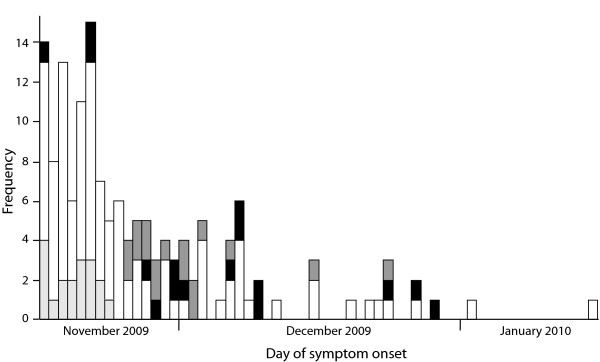
Figure 2.
Epidemiological curve of included cases by exposure. Cases who were exposed (black), or assumed to be exposed (dark grey), and those whose vaccination was assumed to have taken place within 7 days before symptom onset (assumed unexposed; light grey) or who were unexposed (white) are presented by day of symptom onset. The assumption on exposure was based on cases with known date of vaccination. * For 1 patient, day of symptom onset was unknown. For this patient we used 1 day before day of admission as day of symptom onset for this epidemic curve.

