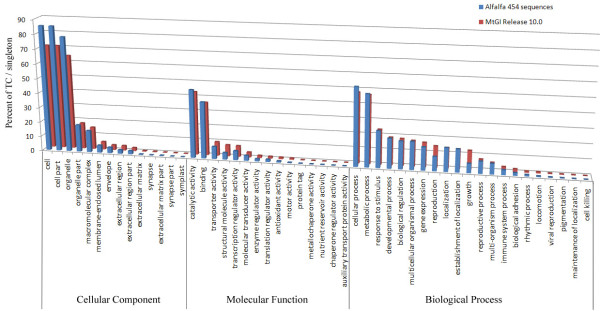
Figure 1.
Comparative distribution of gene ontology assignment of sequences derived from 454 sequencing of cDNA from M. sativa and those in the M. truncatula gene index (MtGI release 10.0). Assignment is expressed as percent of singleton/TC allocated to functional groups within each of three broad categories.

